Onvera Care Quality

AI Oncology Care Quality Platform

Every chart reviewed against every measure, turned into the work queue each team clears before the next visit.

app.onverahealth.com
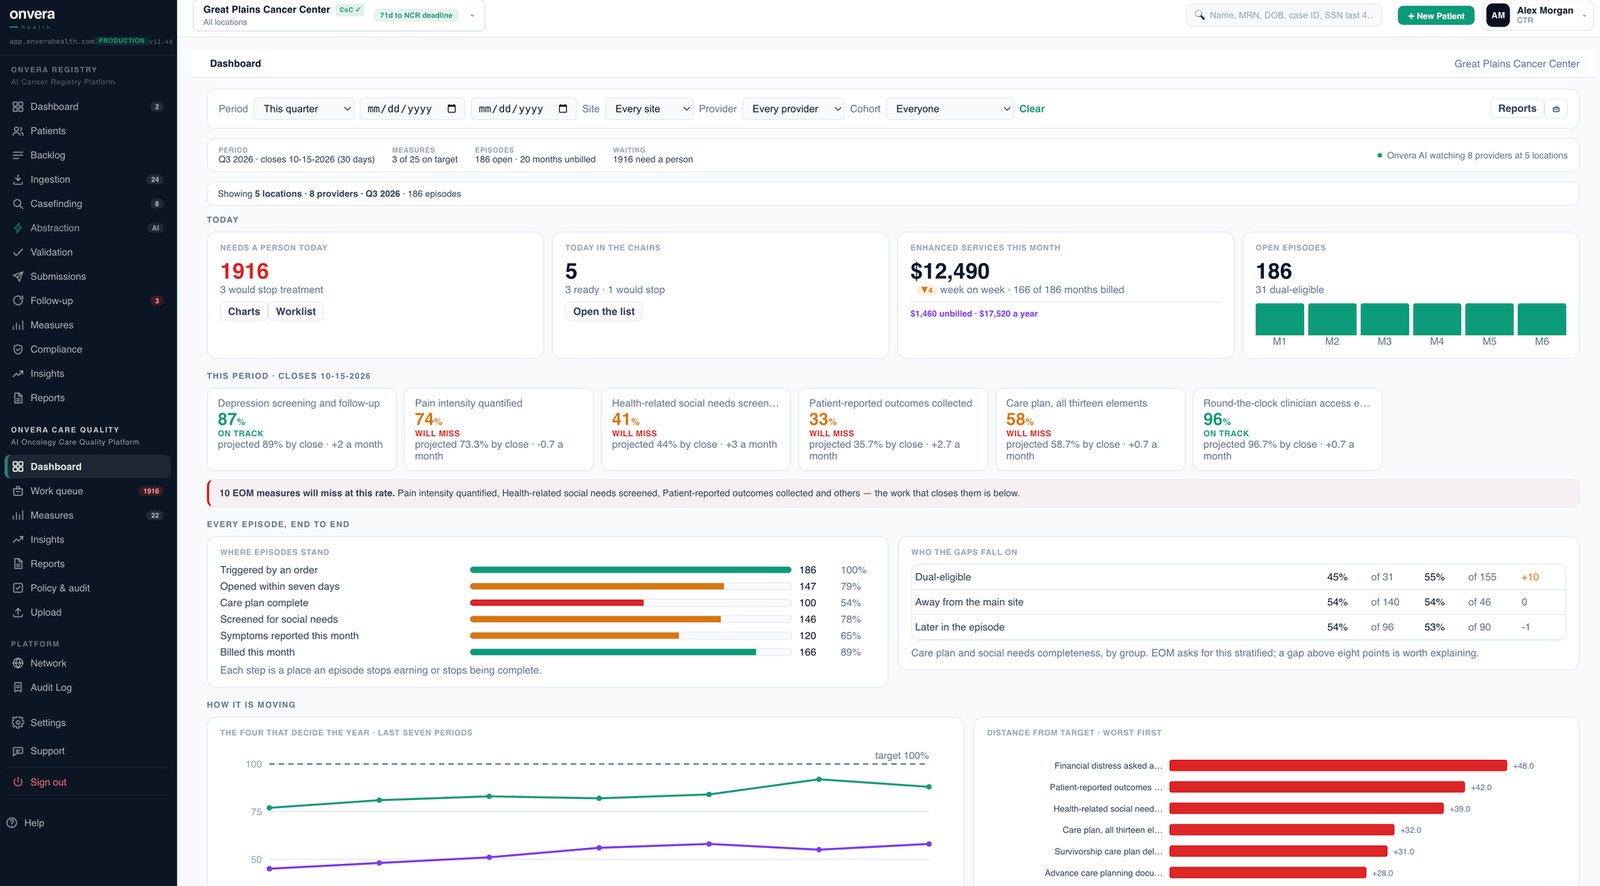
Onvera Care Quality dashboard showing measures on target, open episodes, work queue and gaps by group
Onvera Care Quality dashboard. Demo program, demo data.
What it does

Chart review, worklists, scorecards, KPIs.

01
Chart review
Structured fields and notes, every patient, every measure.
Chart review · sample Met
Depression screen
PHQ-9 documented, score 4
Progress note
Pain plan of care
Plan recorded after pain score 6
Nursing note
02
Nurse workflow
Charts checked the night before, documentation audited after.
✓Orders for date of serviceReady
✓Consent on fileReady
!Recent labsMissing
!Authorization holdOpen
Tomorrow's infusions · sample 2 to fix
03
Provider scorecards
Each provider against the practice, month over month.
EOM-4a
94%
EOM-4b
63%
EOM-5
81%
This period · sample 38 to catch
04
Program KPIs
One view of where the program stands, and where it varies.
86%
Measures met
71%
Gaps closed at next visit
4d
Median days to close
25pt
Provider spread
Practice · sample 3 locations
Depression screening
Pain assessment
Pain plans of care
Treatment plans
Palliative care referrals
Hospice referrals
Smoking cessation
Advance care planning
Infusion chart readiness
Nursing documentation audits
EOM measure tracking
Provider and location comparison
Measure trends over time
Patient-level gap lists
Early risk warnings
Measures you define
Data flow

Every source in. Every team served.

Metrics shown are illustrative.

See Onvera Care Quality on your own program.

Or email hello@onverahealth.com